
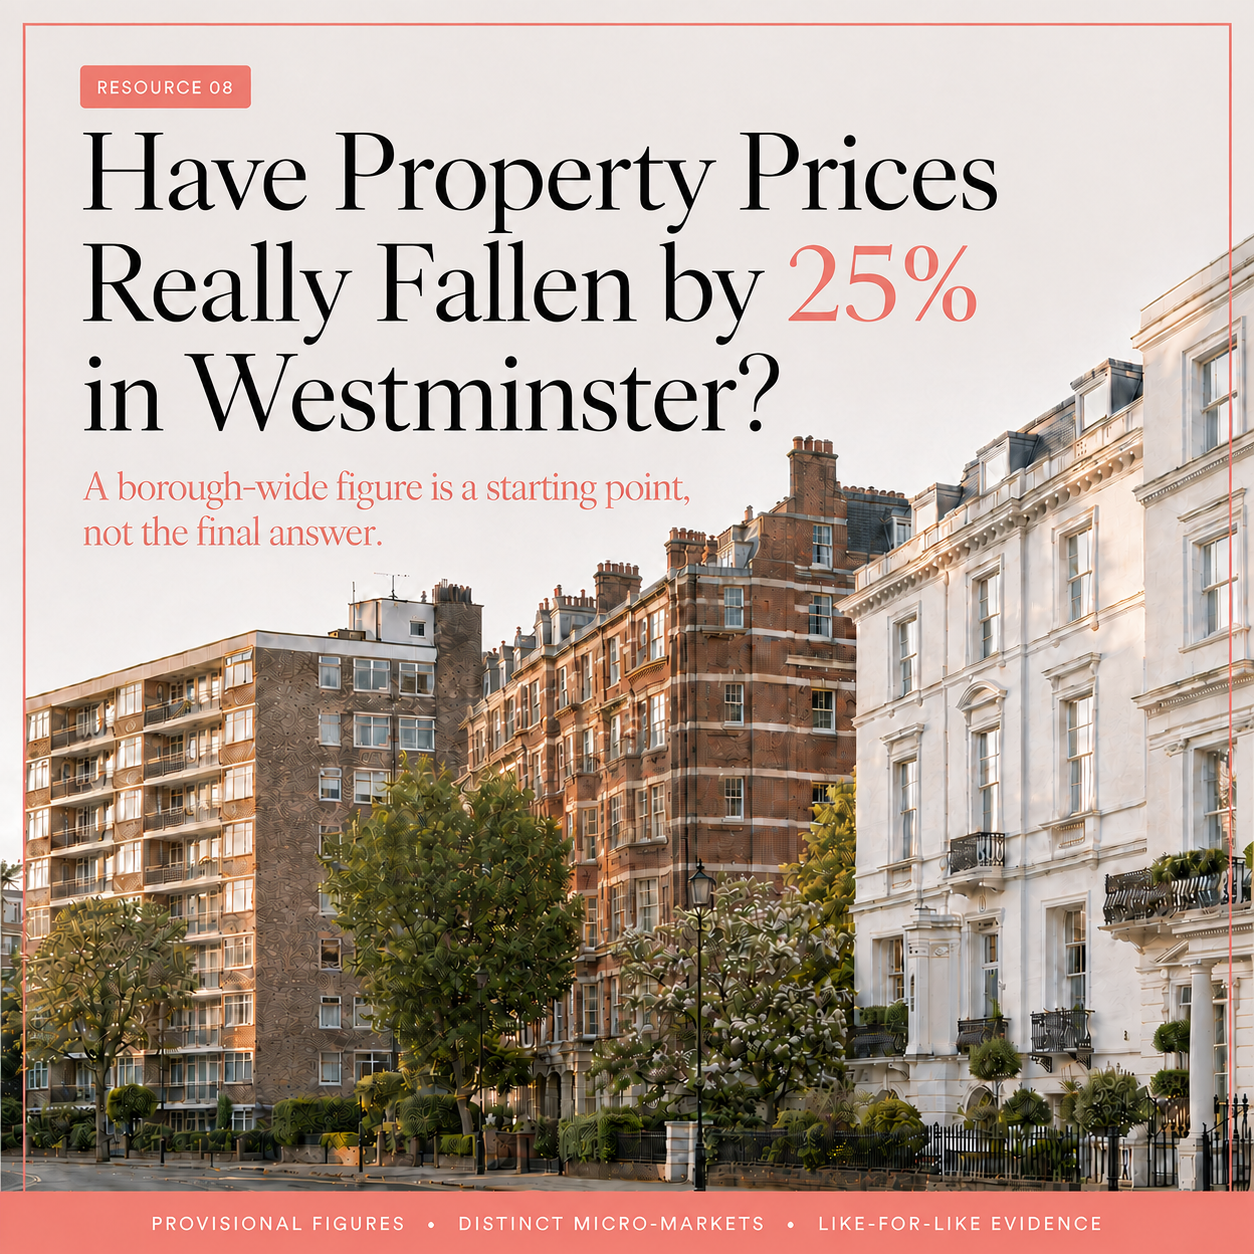
What the latest figures may and may not tell buyers, sellers and landlords
A headline suggesting that property prices have fallen by more than 25% is likely to attract attention. For homeowners, it may prompt an uncomfortable question: has my property really lost a quarter of its value?
For buyers, the same figure may suggest that Westminster has suddenly become significantly more affordable, or that waiting a little longer could bring even lower prices.
The latest provisional figures from the Office for National Statistics and HM Land Registry appear striking. They estimate that the average property price in Westminster was approximately £854,000 in June 2026, representing a fall of 25.4% compared with June 2025. Over the same period, the estimated average price across London fell by 2.5%.
The figures deserve attention, but they also deserve context. The short answer is: not necessarily. The figure indicates significant movement within the wider Westminster market, but it cannot be applied directly to every property in the borough.
A borough-wide statistic can help us understand the apparent direction of a market. It cannot, by itself, tell us what has happened to the value of one particular home.
What Does the 25% Figure Actually Tell Us?
The UK House Price Index is designed to measure changes in residential property prices over time. It is not calculated by simply adding together the prices of all properties sold during a month and producing an ordinary average.
The data is adjusted to account for differences between the types and characteristics of homes changing hands during different periods. That makes it more useful than a straightforward average, but it does not remove every limitation.
The index measures estimated changes in transaction prices. It does not represent a fresh valuation of every home in Westminster.
The latest Westminster figure is also marked as provisional. Property transactions can take time to be registered and added to the underlying data, so House Price Index estimates remain subject to revision as more information becomes available. HM Land Registry operates a 12-month revision period for the index.
Local-authority figures are based on considerably fewer transactions than London-wide or national estimates. This can make short-term movements within individual boroughs more variable, particularly in a high-value market such as Westminster.
Is the Headline Being Driven by Prime Property?
One reasonable question is whether the headline figure has been driven mainly by a change in the number of million-plus, multimillion-pound or super-prime homes being sold. In a borough where individual transactions can reach several million pounds, the mix of properties changing hands can have a substantial effect on a simple average.
However, the published breakdown suggests that the movement is not confined to a handful of exceptionally expensive sales. The estimated average price of flats and maisonettes was down 25.7% year on year, while terraced homes were down 23.4%. Prices paid by first-time buyers were estimated to be 25.3% lower and those paid by mortgage buyers 25.2% lower.
These figures do not prove that every property type, street or price bracket has moved in the same way. They do indicate that the headline cannot be dismissed simply as the result of a few super-prime transactions.
Flats are likely to be particularly relevant to the borough-wide figure because they make up a large part of Westminster’s housing stock and transaction market. Even within that category, however, a broad average brings together homes that buyers would not regard as direct alternatives.
Westminster Is Not One Property Market
Westminster contains a remarkably wide range of homes. Even within W2, W9 and NW8, Wendy Obuli Property’s core areas of coverage, buyers may encounter stucco-fronted terraces, red-brick mansion flats, period conversions, purpose-built apartment blocks, mews houses, contemporary developments, local-authority and ex-local-authority homes, and a smaller number of detached properties.
These are not simply different architectural styles. They can attract different buyers, carry different running costs and be affected by different considerations, including condition, lease length, service charges, floor level, lift access, outside space and the quality of the immediate position.
Little Venice offers a useful example. John Aird Court sits among detached homes, red-brick mansion blocks and other substantially more expensive properties. At the time of writing, a three-bedroom flat there can be offered at around the same price as a one-bedroom flat in a nearby mansion block.
Both properties may be located within a small geographical area, but they are not interchangeable. Their size, tenure, building type, buyer profile, running costs and resale market may differ considerably.
This diversity helps explain why a borough-wide figure can appear dramatic without describing the experience of every Westminster homeowner. The closer the evidence is to the property being assessed, the more useful it becomes.
What Does This Mean for Sellers?
A seller should not automatically reduce an expected value by 25% because of a borough-wide headline. The more useful question is how genuinely comparable properties are performing now.
That means looking beyond postcode and bedroom count. Recent evidence should, where possible, reflect the same property type, condition, size, tenure, lease position, service-charge level, floor, outside space and immediate location.
Current competition matters too. A property can compare well with historic sales but still struggle if buyers have several stronger alternatives at a similar price. Viewing levels, repeated feedback and the relationship between asking prices and completed sales can provide important context.
The headline may point to a more price-sensitive market, but it does not replace a careful, property-specific appraisal.
What Does This Mean for Buyers?
For buyers, the reported fall may create opportunity, but it does not mean that every Westminster home is now available at a 25% discount. Desirable, well-presented properties with sensible pricing can still attract competition, while homes with drawbacks or ambitious asking prices may offer greater negotiating room.
Broad market figures can help a buyer question assumptions and examine value more carefully. They can also strengthen the case for comparing recent evidence rather than relying on an asking price or an older neighbouring sale.
A lower headline figure is therefore best treated as a reason to investigate, not as a universal reduction to apply to every property.
Should Buyers Wait?
Waiting may feel tempting when a headline suggests prices are falling sharply. However, a buyer is rarely deciding whether to purchase “the Westminster market” in the abstract. They are deciding whether a particular home, at a particular price, meets their needs and represents reasonable value.
Future prices are only one part of that decision. Mortgage costs, availability, personal timing and the scarcity of the right type of property can all affect the outcome. A buyer who waits for a further borough-wide fall may find that the specific homes they want do not follow the same pattern.
That does not mean rushing. It means judging the individual opportunity with suitable legal, financial and surveying advice, rather than allowing one provisional statistic to make the decision on its own.
What Does This Mean for Landlords?
For landlords, a change in capital value does not automatically translate into the same change in rental performance. Sales and lettings markets respond to different pressures, and demand can vary by property type, condition and location.
A lower purchase price may improve the apparent gross yield for a new acquisition, but the full calculation still needs to include service charges, maintenance, finance, void periods, compliance costs and taxation. Existing landlords may be more concerned with refinancing, future plans and whether the property continues to meet their objectives.
As with owner-occupied homes, the most useful evidence is specific. A borough-wide sales figure is context, not a complete investment assessment.
A Final Thought
The latest Westminster figures should not be ignored. They suggest that the market has experienced real pressure and that buyers, sellers and landlords may need to approach decisions carefully, but they do not mean that every Westminster property has lost 25% of its value.
Westminster is made up of distinct micro-markets, and individual homes can perform very differently depending on their type, condition, tenure, price bracket and precise location. The headline is therefore a useful starting point, not the final answer.
If you are considering a sale, purchase or letting decision, the next step is to look at relevant, like-for-like evidence and the current market around the property itself.
Wendy Obuli Property offers a complimentary, no-obligation market appraisal based on relevant comparable properties and current market evidence.
Sources
- Office for National Statistics: Housing prices in Westminster →
- HM Land Registry: About the UK House Price Index →
- HM Land Registry: UK House Price Index quality and methodology →
- Bank of England: Bank Rate →
You May Also Be Wondering?
This article is intended as general information and does not constitute financial, legal, tax, mortgage or investment advice. Property values and market conditions vary, and individual circumstances should be considered with suitably qualified advisers.
Information and links checked on 19 August 2026.